
Instagram’s Insights feature not only allows creators to analyze engagements and interactions on their profiles and posts, but it also offers detailed analytics for Instagram Stories.
While most of these metrics are pretty straightforward, a few of them are unique to the Stories feature. So what does navigation mean on Instagram?
Today’s guide will go in-depth on every Instagram Stories metric, and much more.
Key Points:
How To View Live Story Insights
While you can go directly to the Insights page to view analytics for past Stories, you can also view a number of Insights directly from the Story itself while it’s live or in a Highlight.
On Mobile
Tap your profile picture to open your Story.
Tap the Activity icon on the bottom left.

From here you’ll be able to see who viewed your Story.
If they interacted in some way, you’ll see their engagement next to their name.
To view detailed Insights, tap the graph icon to the left.
You can learn more about what each metric means here.
On Desktop
Click your profile picture to open your Story.
Click Seen By… on the bottom left corner to access the list of viewers.
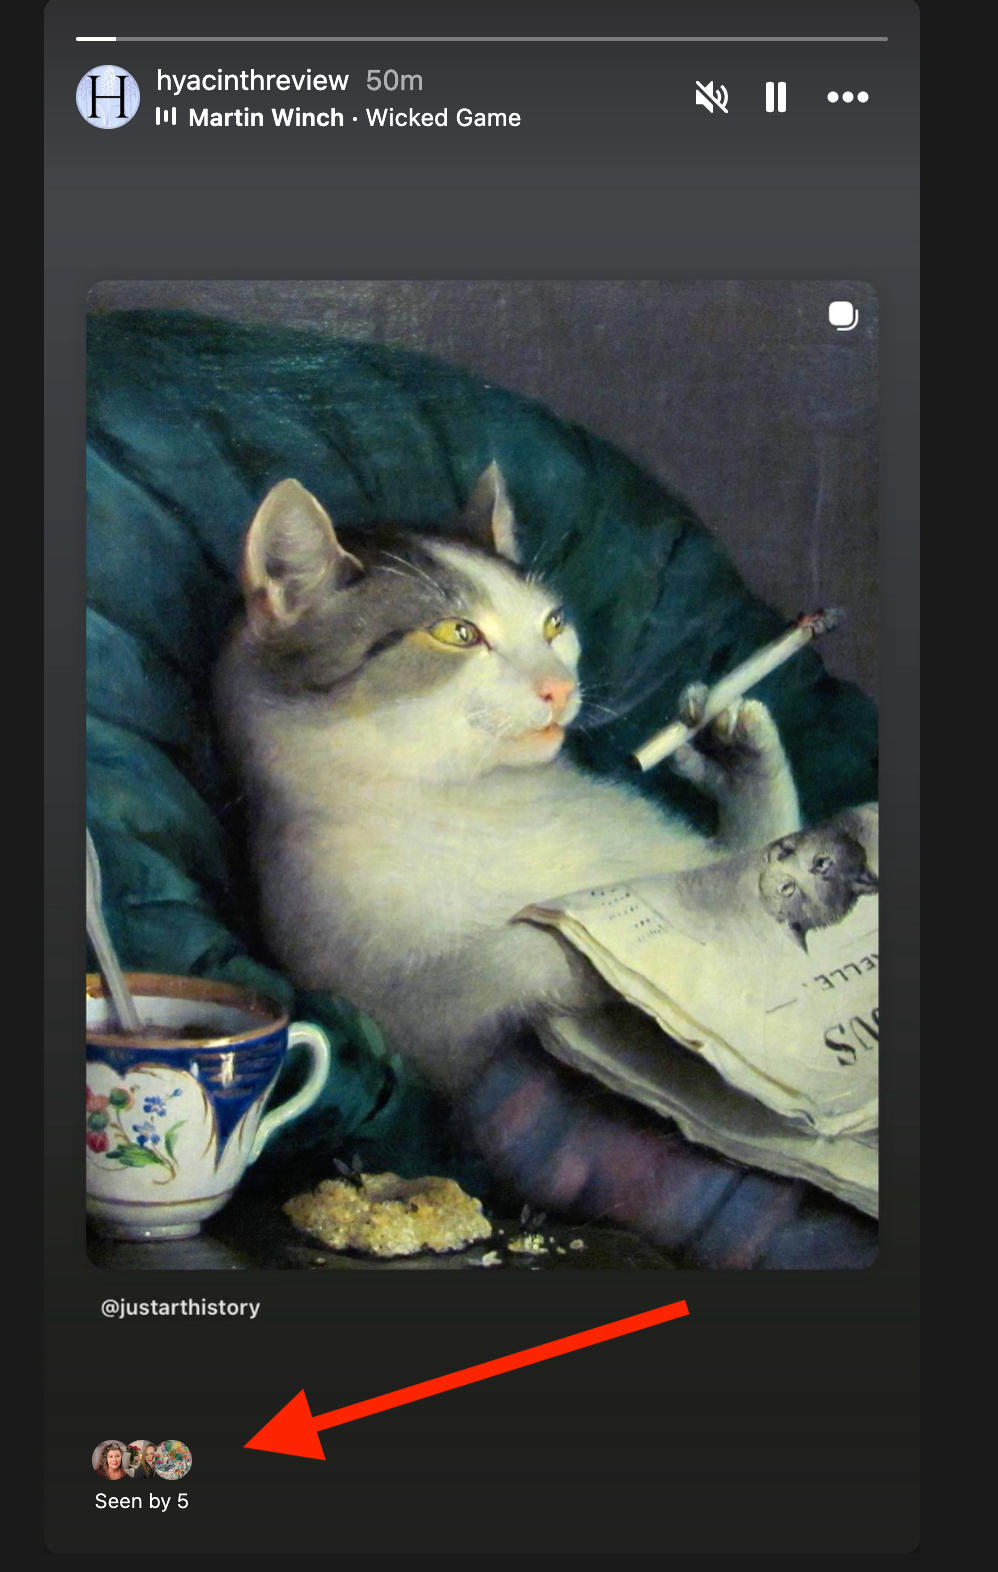
If they interacted in some way, you’ll see their engagement next to their name.
To view detailed Insights, return to the main Story page and click the three dots on the top right corner.

Click View Insights.
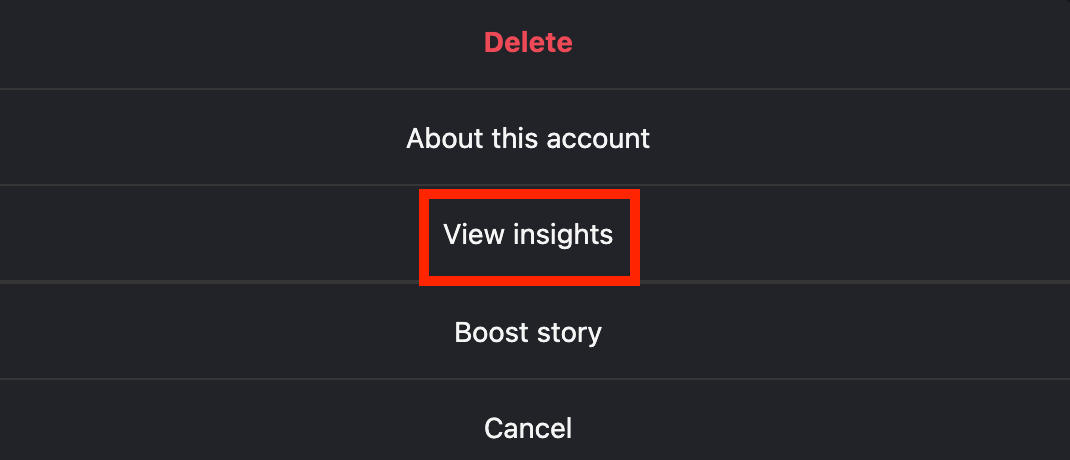
You can learn more about what each metric means here.
How To Read Instagram Stories Analytics
To access Story analytics directly within the Insights dashboard, follow the steps outlined below depending on your device type.
Keep in mind that you’ll have to be accessing Instagram from a Business or Creator account in order to use the Insights feature.
On Mobile
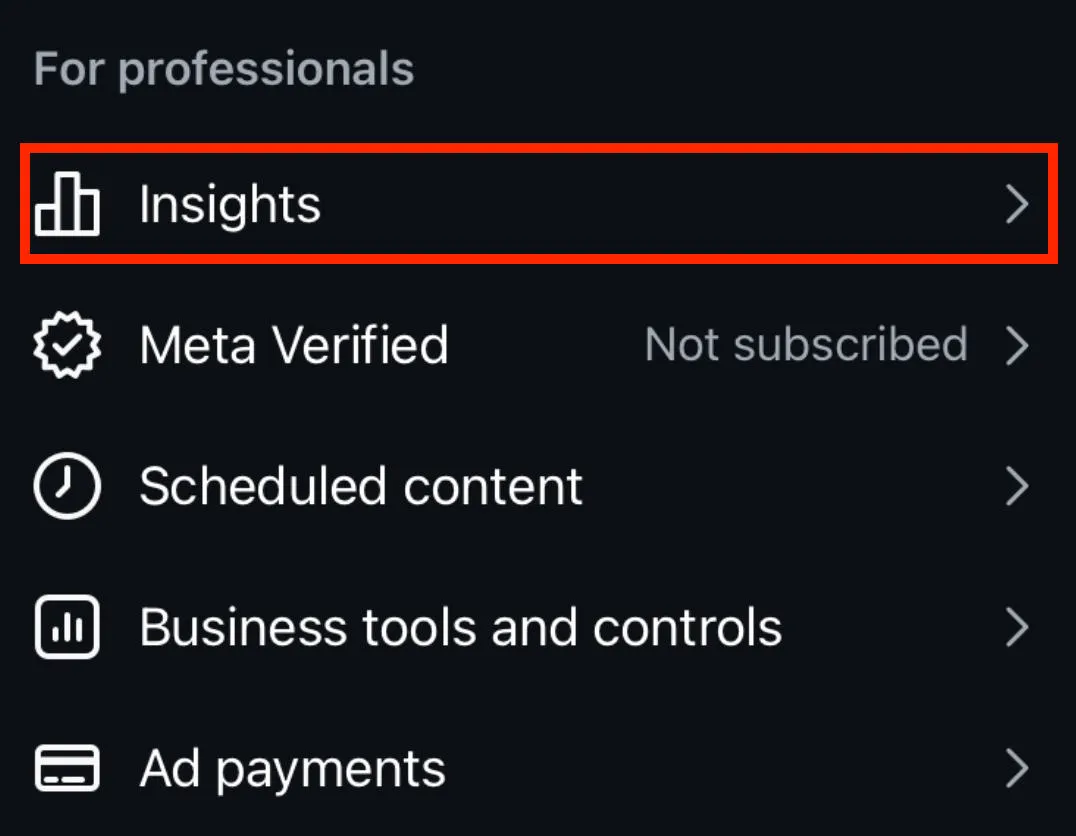
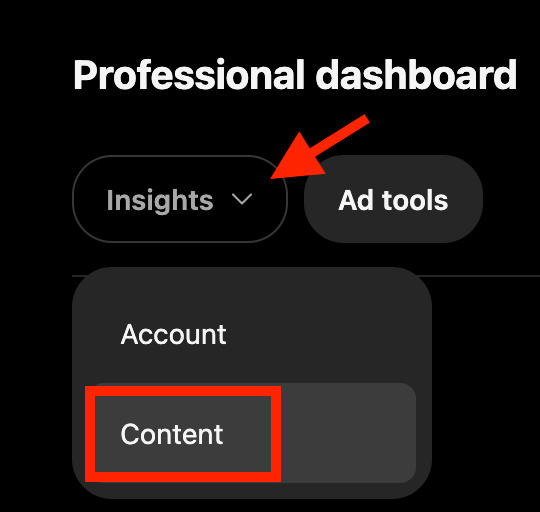
From your profile page, tap the three lines on the top right corner.
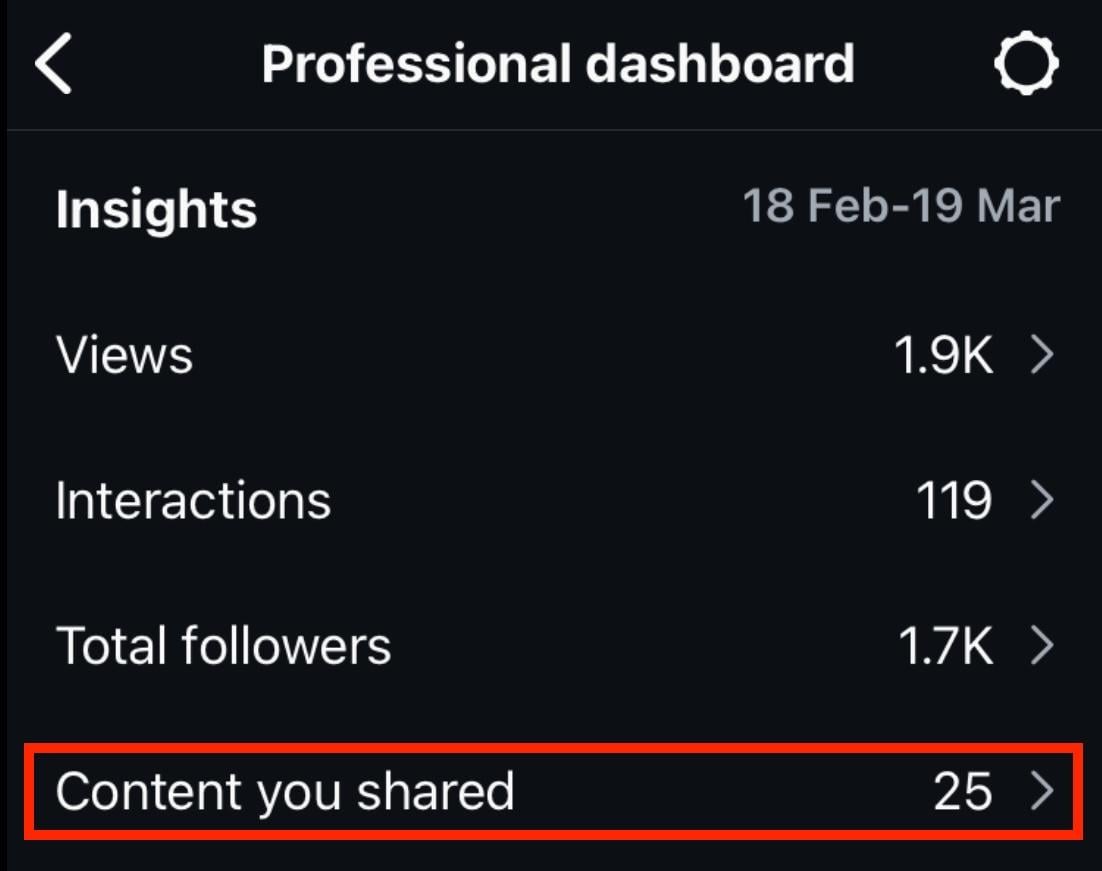
Under For Professionals, tap Insights.
Tap Content You Shared.
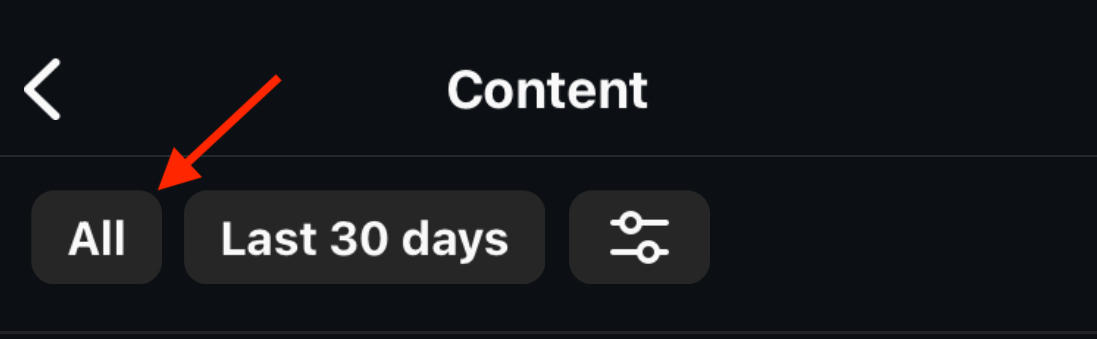
Tap All on the top left.
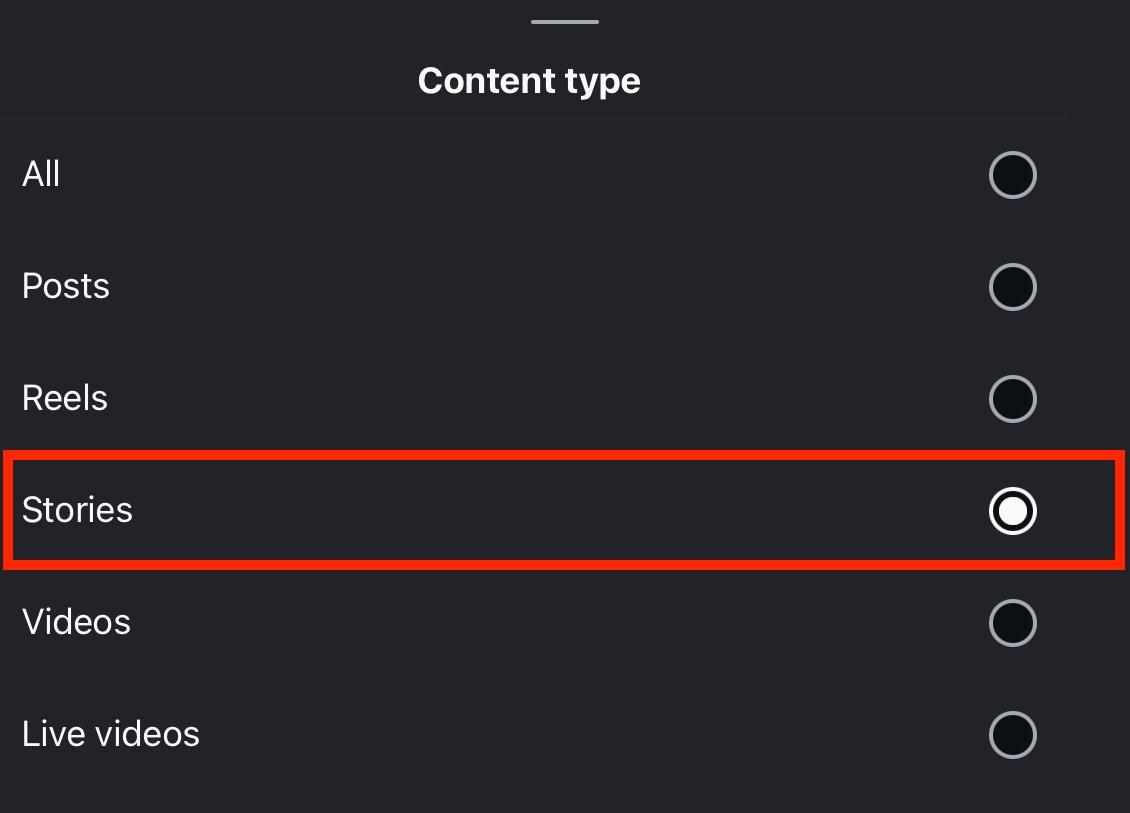
Tap Stories to filter by Stories content.
Tap the specific Story you wish to view Insights for.
You can learn more about what each metric means here.
On Desktop
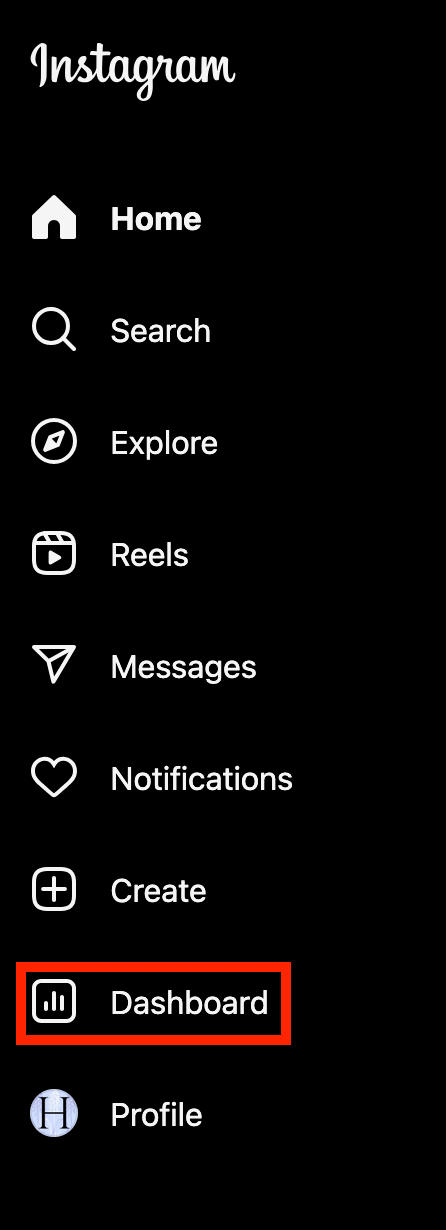
From the left-hand menu, click Dashboard.
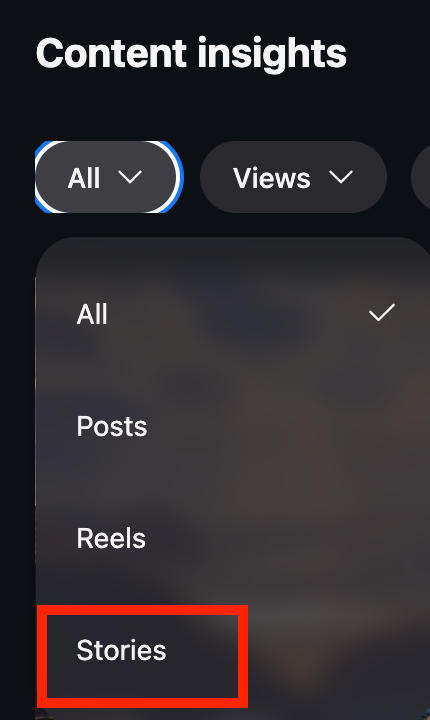
Click Insights then select Content.
Click All.
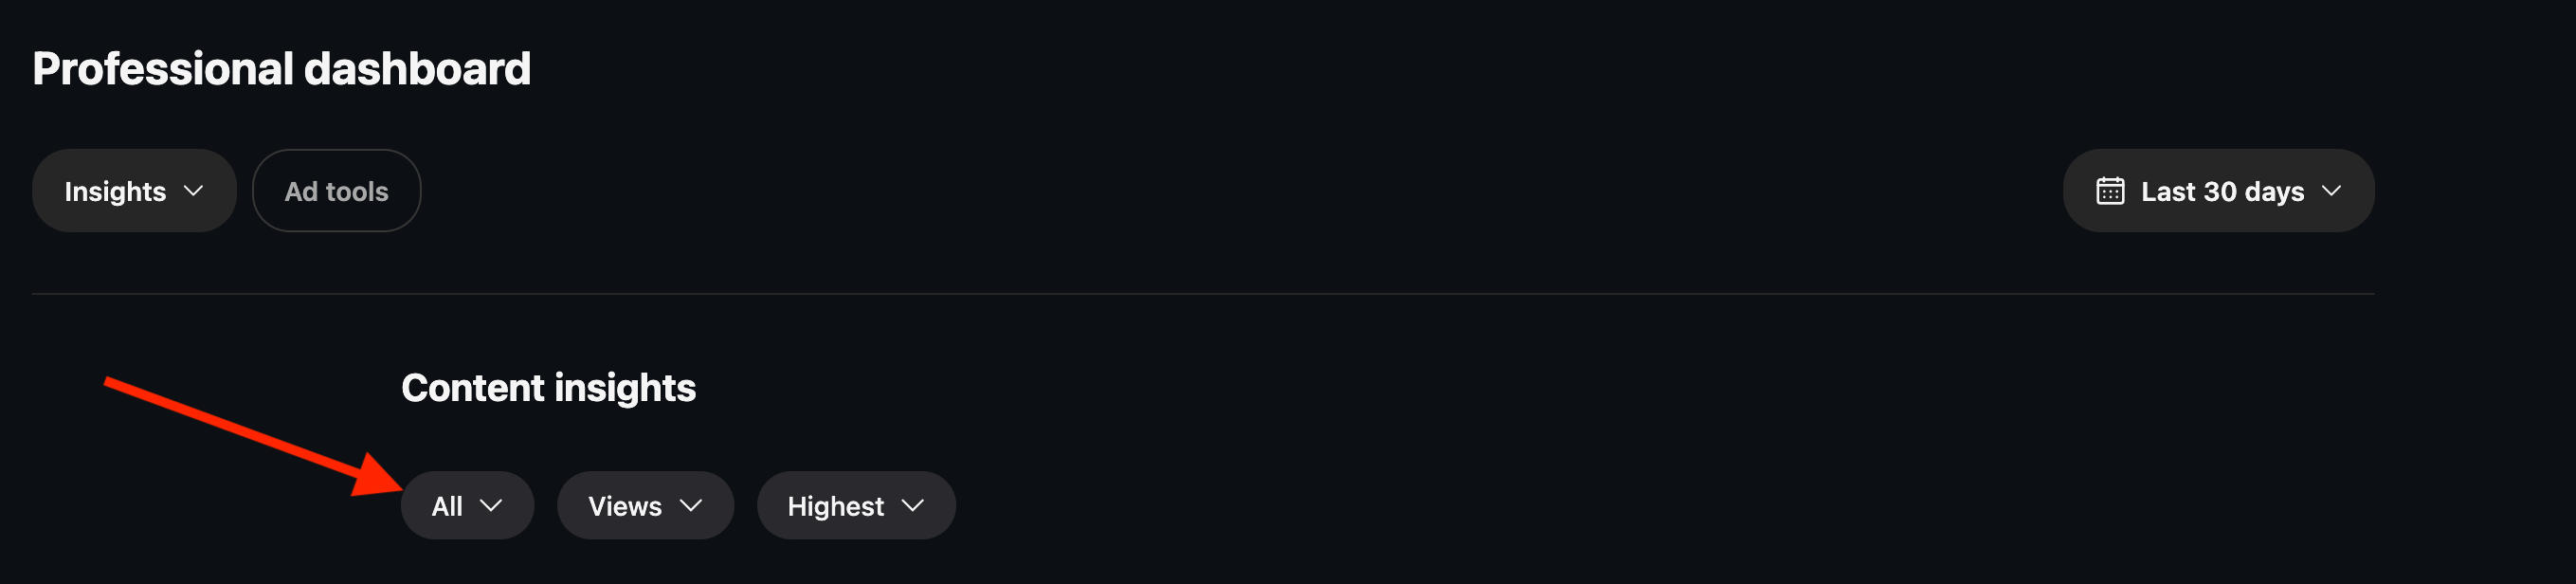
Filter by Stories.
Click the specific Story you wish to view Insights for.
You can learn more about what each metric means here.
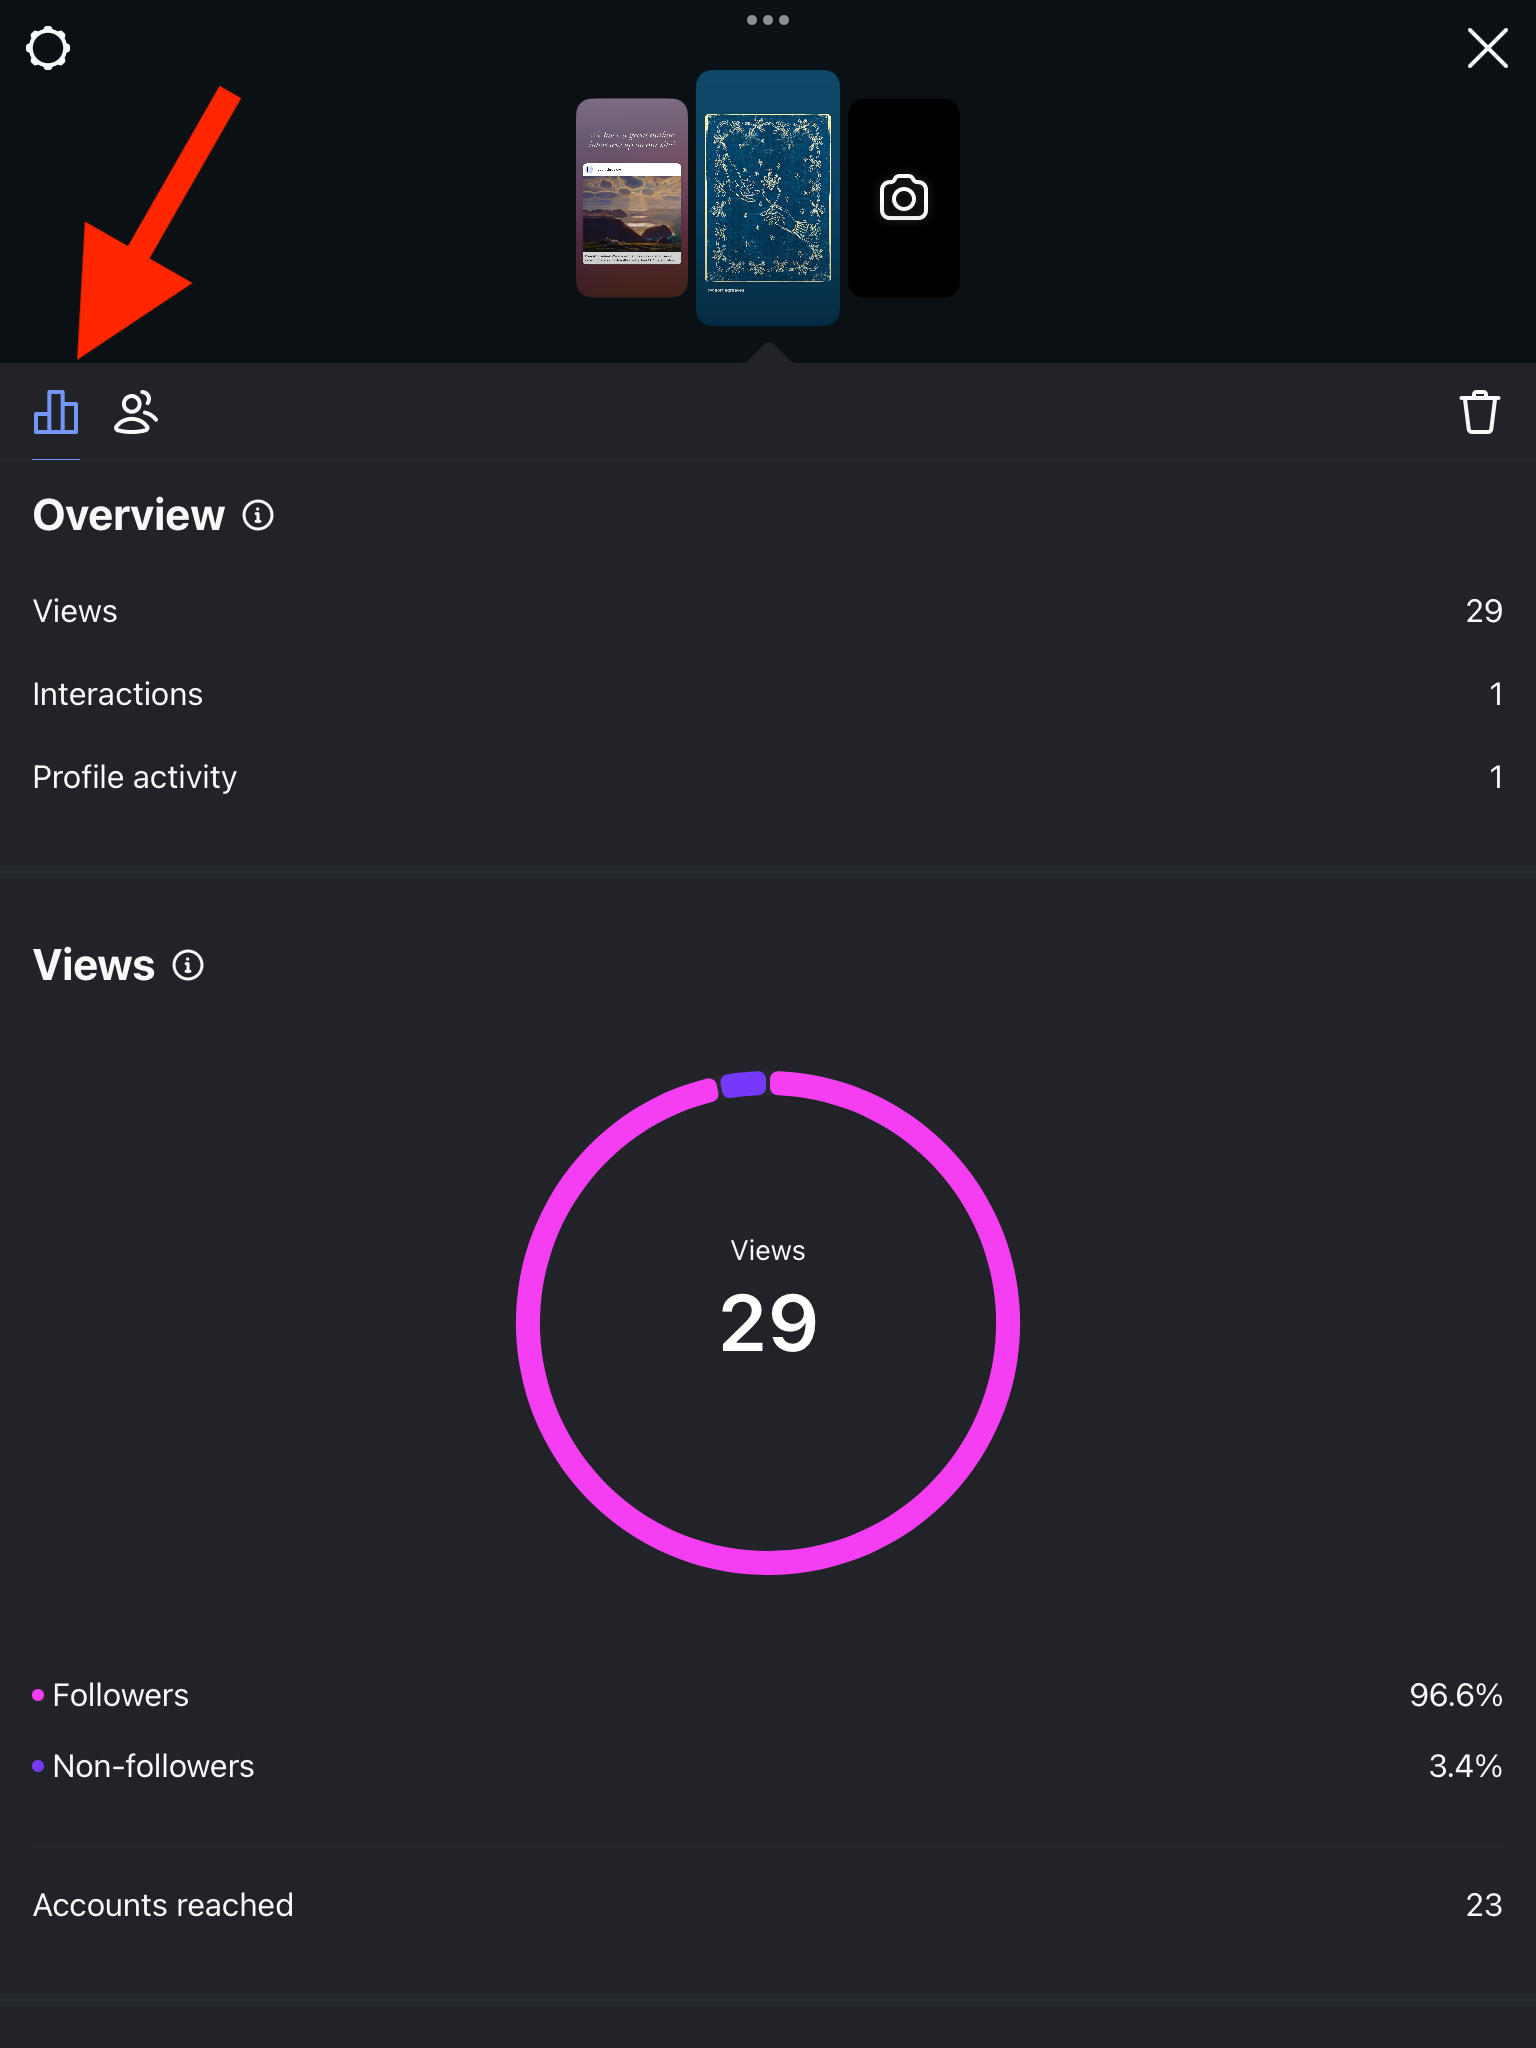
Story Overview Metrics Explained
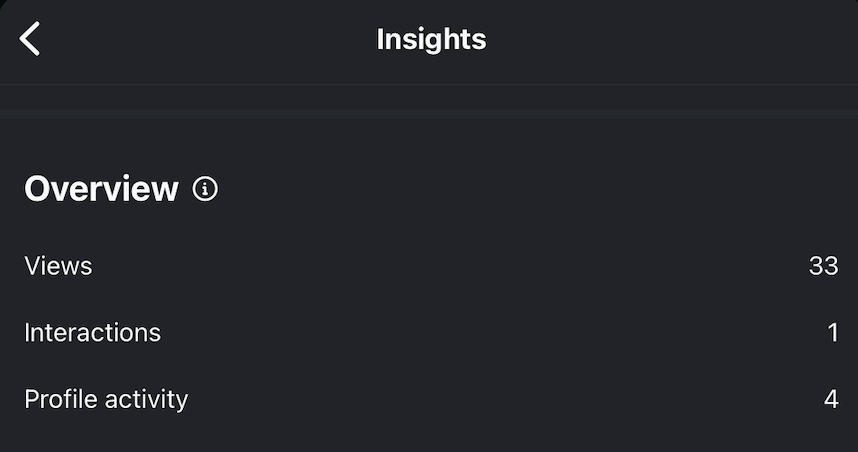
The first section that appears on the Story Insights page is the metrics overview.
This includes views, interactions, and profile activity.
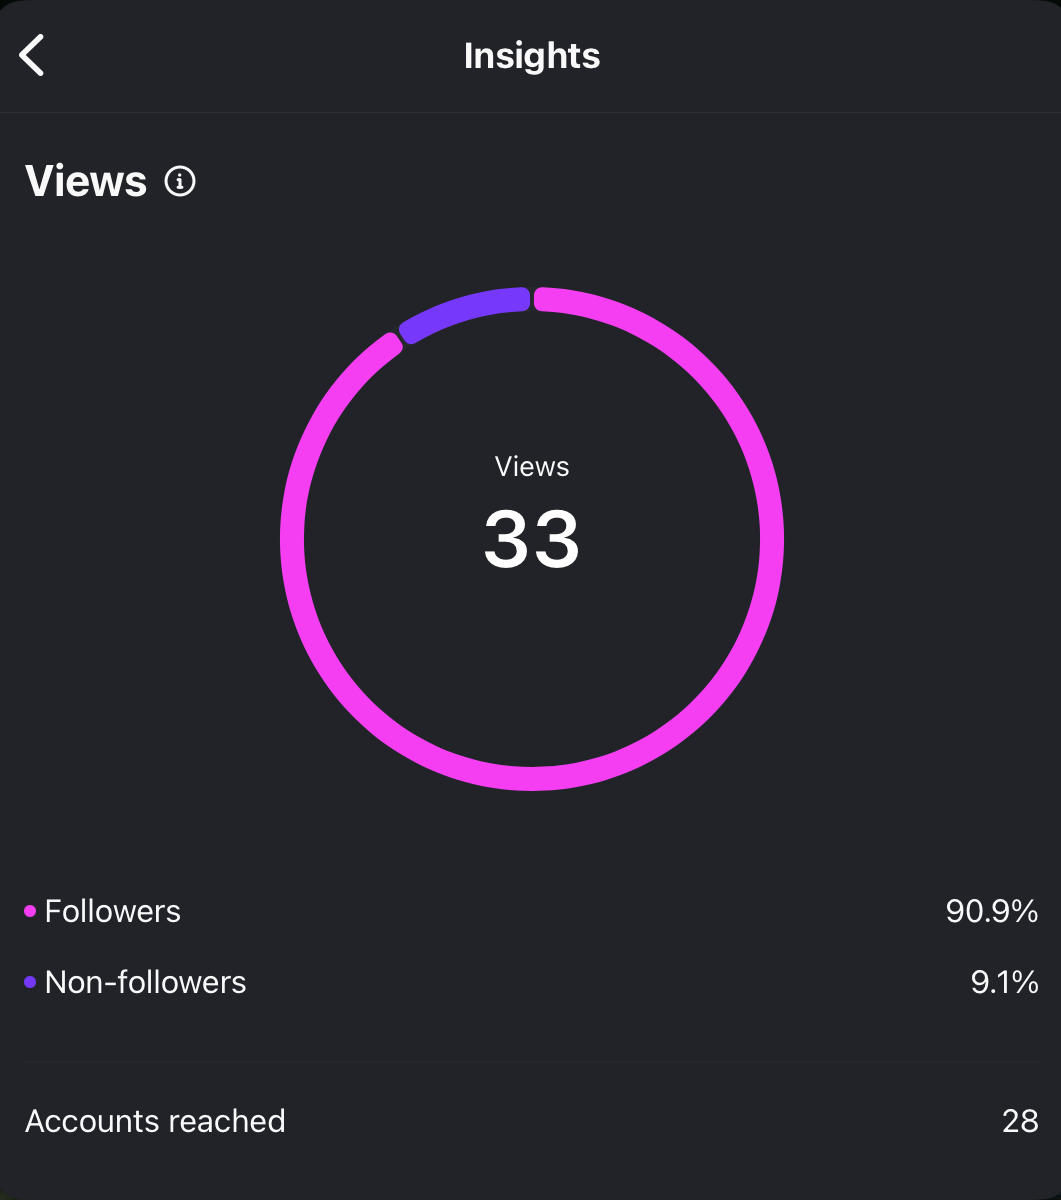
Views
This metric measures how many times your Story was played. More than one view can be generated by the same user if they open your Story more than once.
Interactions
This measures the number of likes, replies, and shares your Story received as a total metric. You can view a more detailed breakdown of these interactions later in the Insights.
Profile Activity
Profile activity measures the number of actions users take when they visit your profile after they’ve engaged with your Story.
For example, if someone opens your Story then taps your profile picture to view your profile and either follows you, unfollows you, clicks a link, or engages with a post on your profile, this counts as profile activity.
Story Views Metrics Explained
If you scroll down to the Views section, you’ll see a more detailed breakdown of your Story views and where they’ve come from.
Followers vs. Non-Followers
The pink and purple graph shows a breakdown of how many views came from your followers versus users who aren’t currently following you.
Generally you’ll have a higher follower rate here, since Stories are more readily visible to users who are already following you.
However, if you notice that more non-followers view your Story than followers, or you’re noticing a higher rate than usual, that could mean that more users are discovering your profile.
While this isn’t necessarily a bad thing, you may want to consider ways to convert those non-followers into followers through your content.
We’ll get more into how you can do that at the end of this guide, but for now keep reading.
Accounts Reached
Accounts reached simply measures the total number of accounts you reached with your Story.
You may notice that this number is lower than the number of views; that’s because users can generate more than one view each.
Story Interactions Metrics Explained
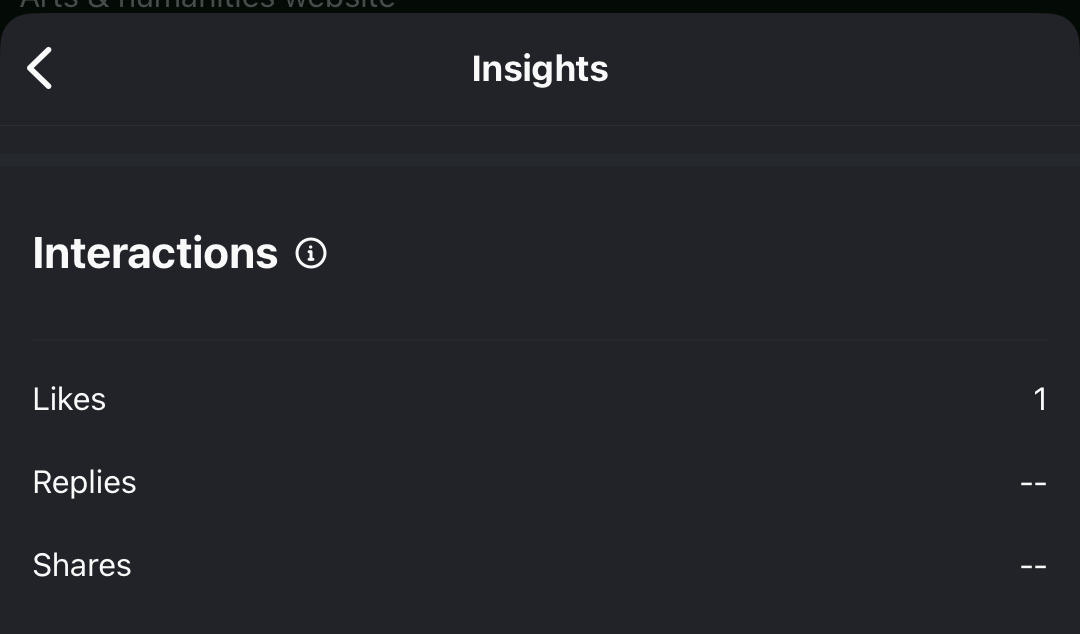
Like regular Instagram posts, Stories can be engaged with by viewers either through likes, replies, and shares.
Likes
These occur when a user taps the heart icon on the bottom right of a Story. You can also see the Likes count from the Story itself next to the View count.
Replies
When a user sends you a message directly through a Story, that counts as a reply. You’ll usually receive these messages in your inbox.
Shares
Shares are generated when a user shares a Story to another Instagram user through their DMs, when they share it to their own Story, or when they share it off-platform using the main Share menu.
Story Navigation Metrics Explained
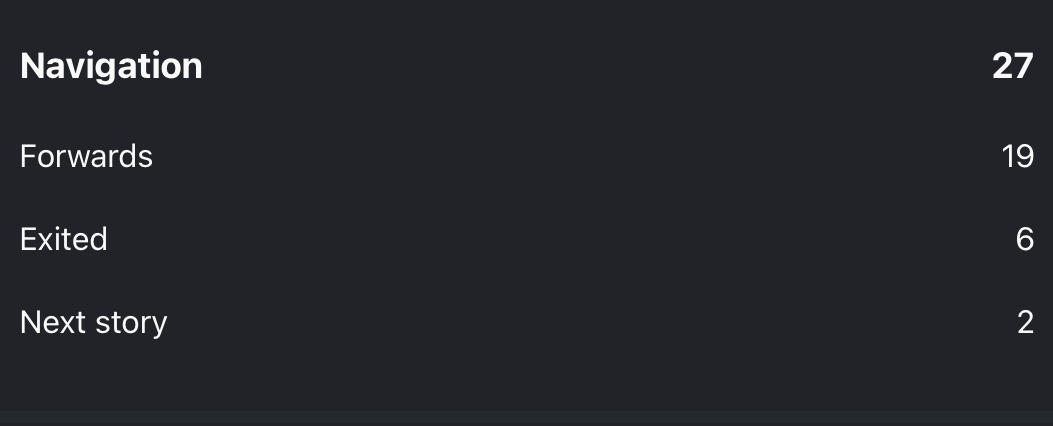
Navigation metrics are unique to Stories, and they’re more important than you might think.
Forwards
Forwards indicate how many users tapped to view the next slide in your Story. This isn’t necessarily a negative thing, as it means users were curious to see what else you posted, rather than swiping to the next user’s Story.
Exited
This measures the number of times users exited your Story entirely, without reaching the end.
Ideally you want this to remain low, since it means your story was low-value in some way.
That might not always be the case, of course, especially if you post updates with a call to action that might encourage users to click elsewhere or visit a link in your bio.
Next Story
This indicates the number of users who swiped to the next user’s Story, rather than viewing the next slide in your own Story.
Much like exits, you want to keep this in the lower ranges.
What Are The Benefits Of Using Story Navigation?
Story navigation indicates how interested users are in what you’re sharing.
Think of it like viewer retention - the more forwards you have, the more users are committed to your Story, whereas the more exits or next story swipes you have the less interested they are.
Story Profile Activity Metrics Explained
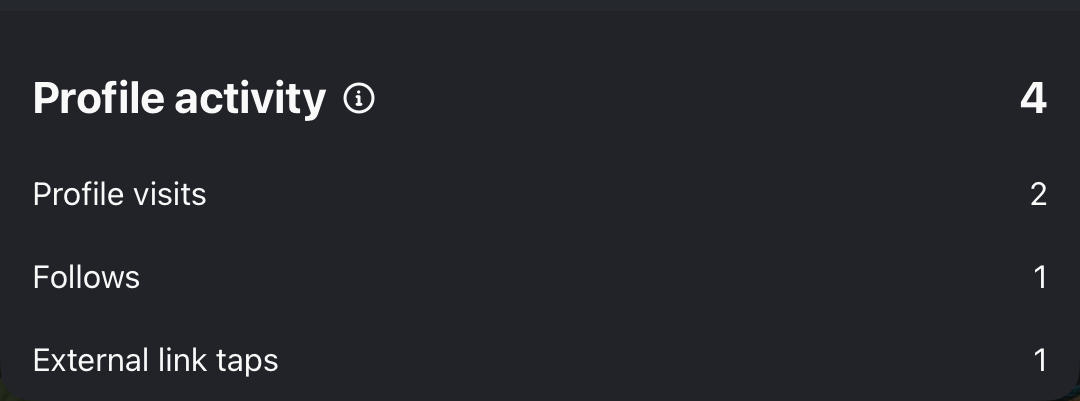
The final section on the Story Insights page is Profile Activity, which includes profile visits, follows, and external link taps.
Profile Visits
This one is simple - it just shows the number of times a user visited your profile directly from your Story.
Follows
This metric indicates the number of times a user followed you immediately after viewing your Story. Usually this won’t be very high, since Stories are most often viewed by users who are already following you.
External Link Taps
If you include a link in your bio and someone clicks it after viewing your Story, this metric will reflect that.
This is an important one to keep an eye on if you’re trying to encourage users to visit your website, landing page, or shop. It’s also especially helpful for creators intending to make money through affiliate marketing.
Tips For Improving Instagram Stories Engagement

Now that we’ve gone through the most important Stories metrics, you may be wondering how you can improve your Story performance.
Not every metric needs to be improved, though, so for the purposes of this guide we’ll focus on the most high-impact metrics: interactions, forward navigation, and external link taps.
Encourage Engagement
Stories aren’t just a slideshow for users to view - they also offer powerful features to encourage user engagement.
Instead of just sharing your latest post and leaving it at that, consider making the most of all that Stories has to offer.
Use the Sticker section to include a Q&A section, polls, emoji reaction button, emoji slidebar, or a link button.
Asking your followers for their opinions, insight, or answers on topics can be a great way to help them feel valued and more inclined to interact with your Story content.
Support Other Creators
Another great way to increase interactions and grow your followers at the same time is to support the posts of other creators.
When you do this, don’t just share their post to your Story and be done with it.
Make sure you tag them directly, and include some type of engagement feature for your viewers to interact with in response to the post.
Not only will this increase the chances of that creator viewing your story and profile, but they may thank you in their Stories which could lead to their followers seeing your content in turn.
Offer Unique Value
People won’t just click for no reason - you have to offer them value.
Host a poll with the promise of using the most popular response in your next bit of content, add a link button that leads to a blog post full of free insights or a digital product.
Whatever it is, make sure that your viewers are getting something in return for their time and engagement.
Be Transparent
Users love knowing that a real person is behind an Instagram account, especially in our current digital climate.
Sharing behind the scenes insights, your struggles as a creator, or even asking your followers for their opinions on a new product or content approach shows that you’re a real person who’s not afraid to be vulnerable.
Frequently Asked Questions
What does navigation exited mean on an Instagram Story?
The exited metric shows the number of users who exited your Story before finishing all the slides.
Do Story viewers know if I screenshot?
No, screenshots on Instagram Stories are anonymous.
Can you see who viewed your profile on Insights?
No, Instagram profile views are totally anonymous. You’ll only be able to see the number of profile views, not the specific user behind the view.
When someone watches your Instagram Story, do they go to the top of the list?
Yes, new Story viewers appear at the top of the Views list. The list is organized in reverse chronological order.